
Analyzing Healthcare Wait Times Across Canadian Provinces (2013–2023)
A comprehensive Tableau and Jupyter-based project analyzing 10 years of Canadian healthcare wait times to uncover trends, COVID-19 impacts, and provincial disparities.
Overview
This project investigates average wait times for key medical procedures in Canada from 2013 to 2023. Using data from the Canadian Institute for Health Information (CIHI), it reveals how provinces performed over time, how COVID-19 impacted the system, and which provinces improved or declined the most.
Tools Used
• Tableau – for visualizing trends and provincial comparisons • Jupyter Notebook – for preprocessing, cleaning, and transforming the raw dataset
Project Objectives
• Analyze trends in wait times across all provinces • Evaluate COVID-19's impact on wait times • Identify the most performed procedures • Highlight provinces with most improvement and most decline in performance
Data Source
Dataset: Wait times for priority procedures in Canada (2024 Edition) Source: Canadian Institute for Health Information (CIHI) Link: CIHI Dataset The dataset includes annual breakdowns by province and procedure, from 2013 to 2023.
Data Cleaning
• Converted all time units to hours • Dropped irrelevant columns (Region, Unnamed, etc.) • Median imputation for missing volume and percentile values • Retained 50th percentile metrics only • Filtered to data between 2013 and 2023
Visualizations and Key Findings
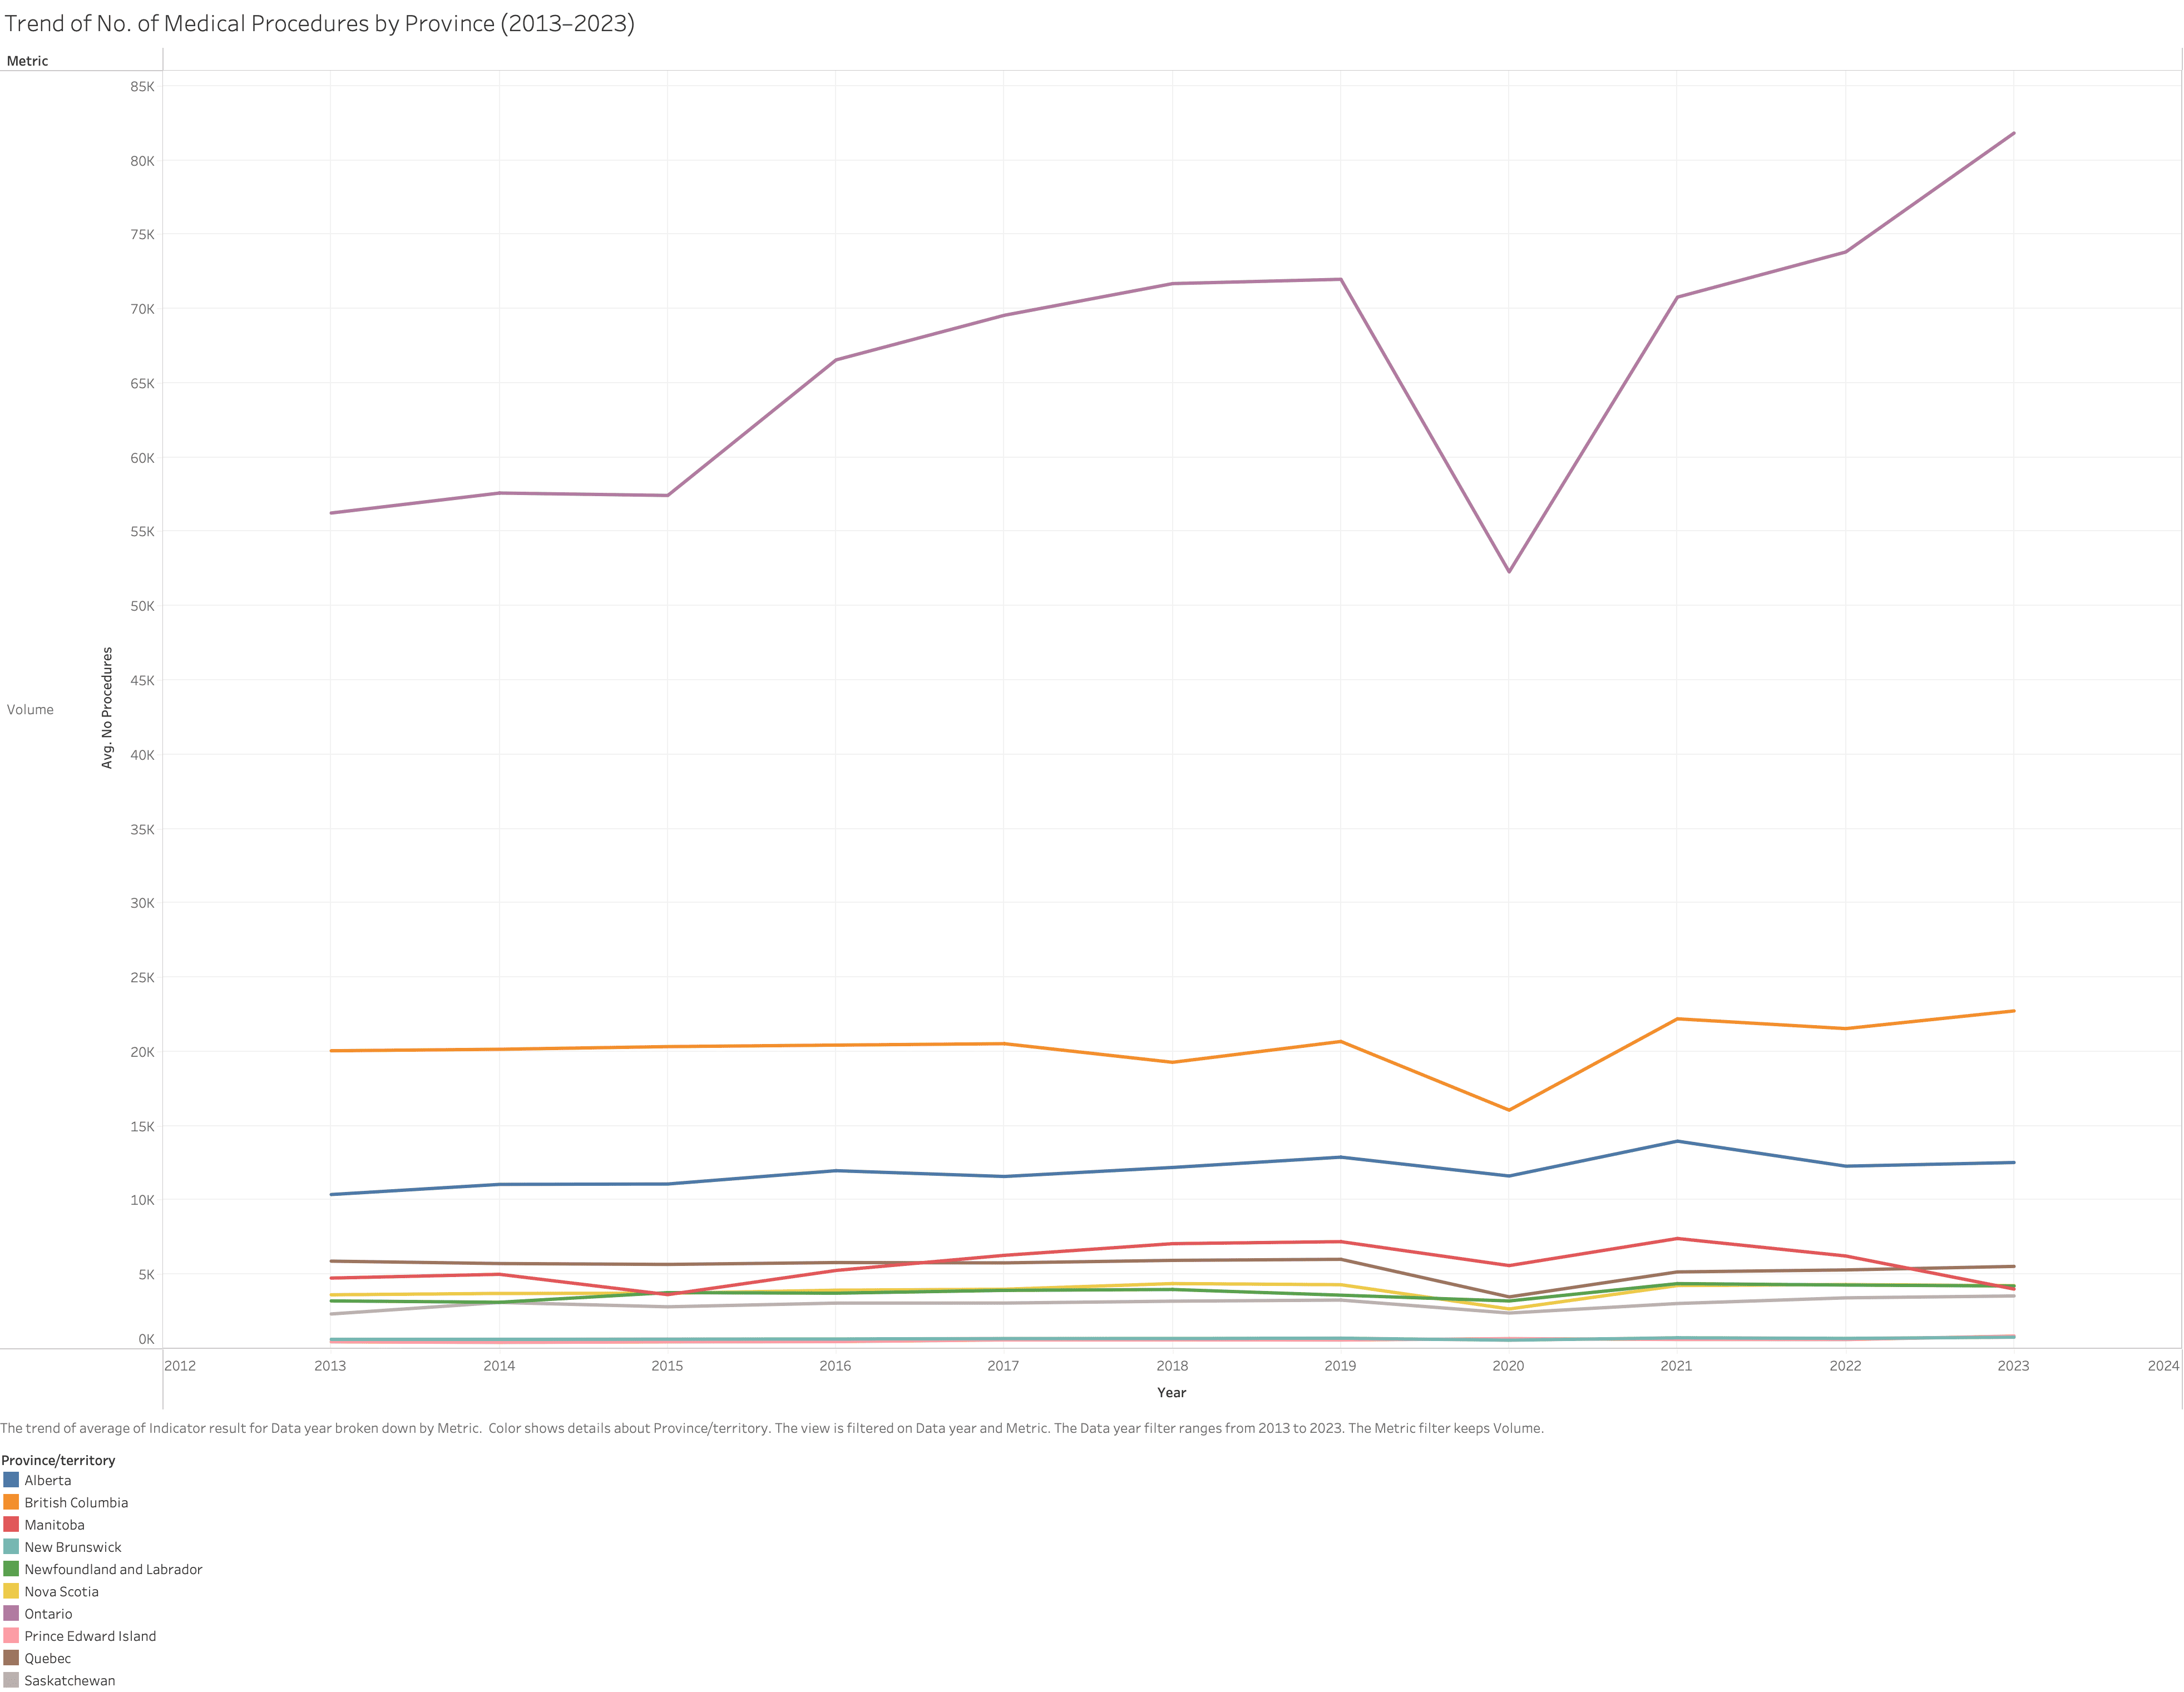
1. Procedure Volume Over Time
Ontario consistently performed the highest number of medical procedures. Dips occurred in 2020 due to COVID-19 but later rebounded.
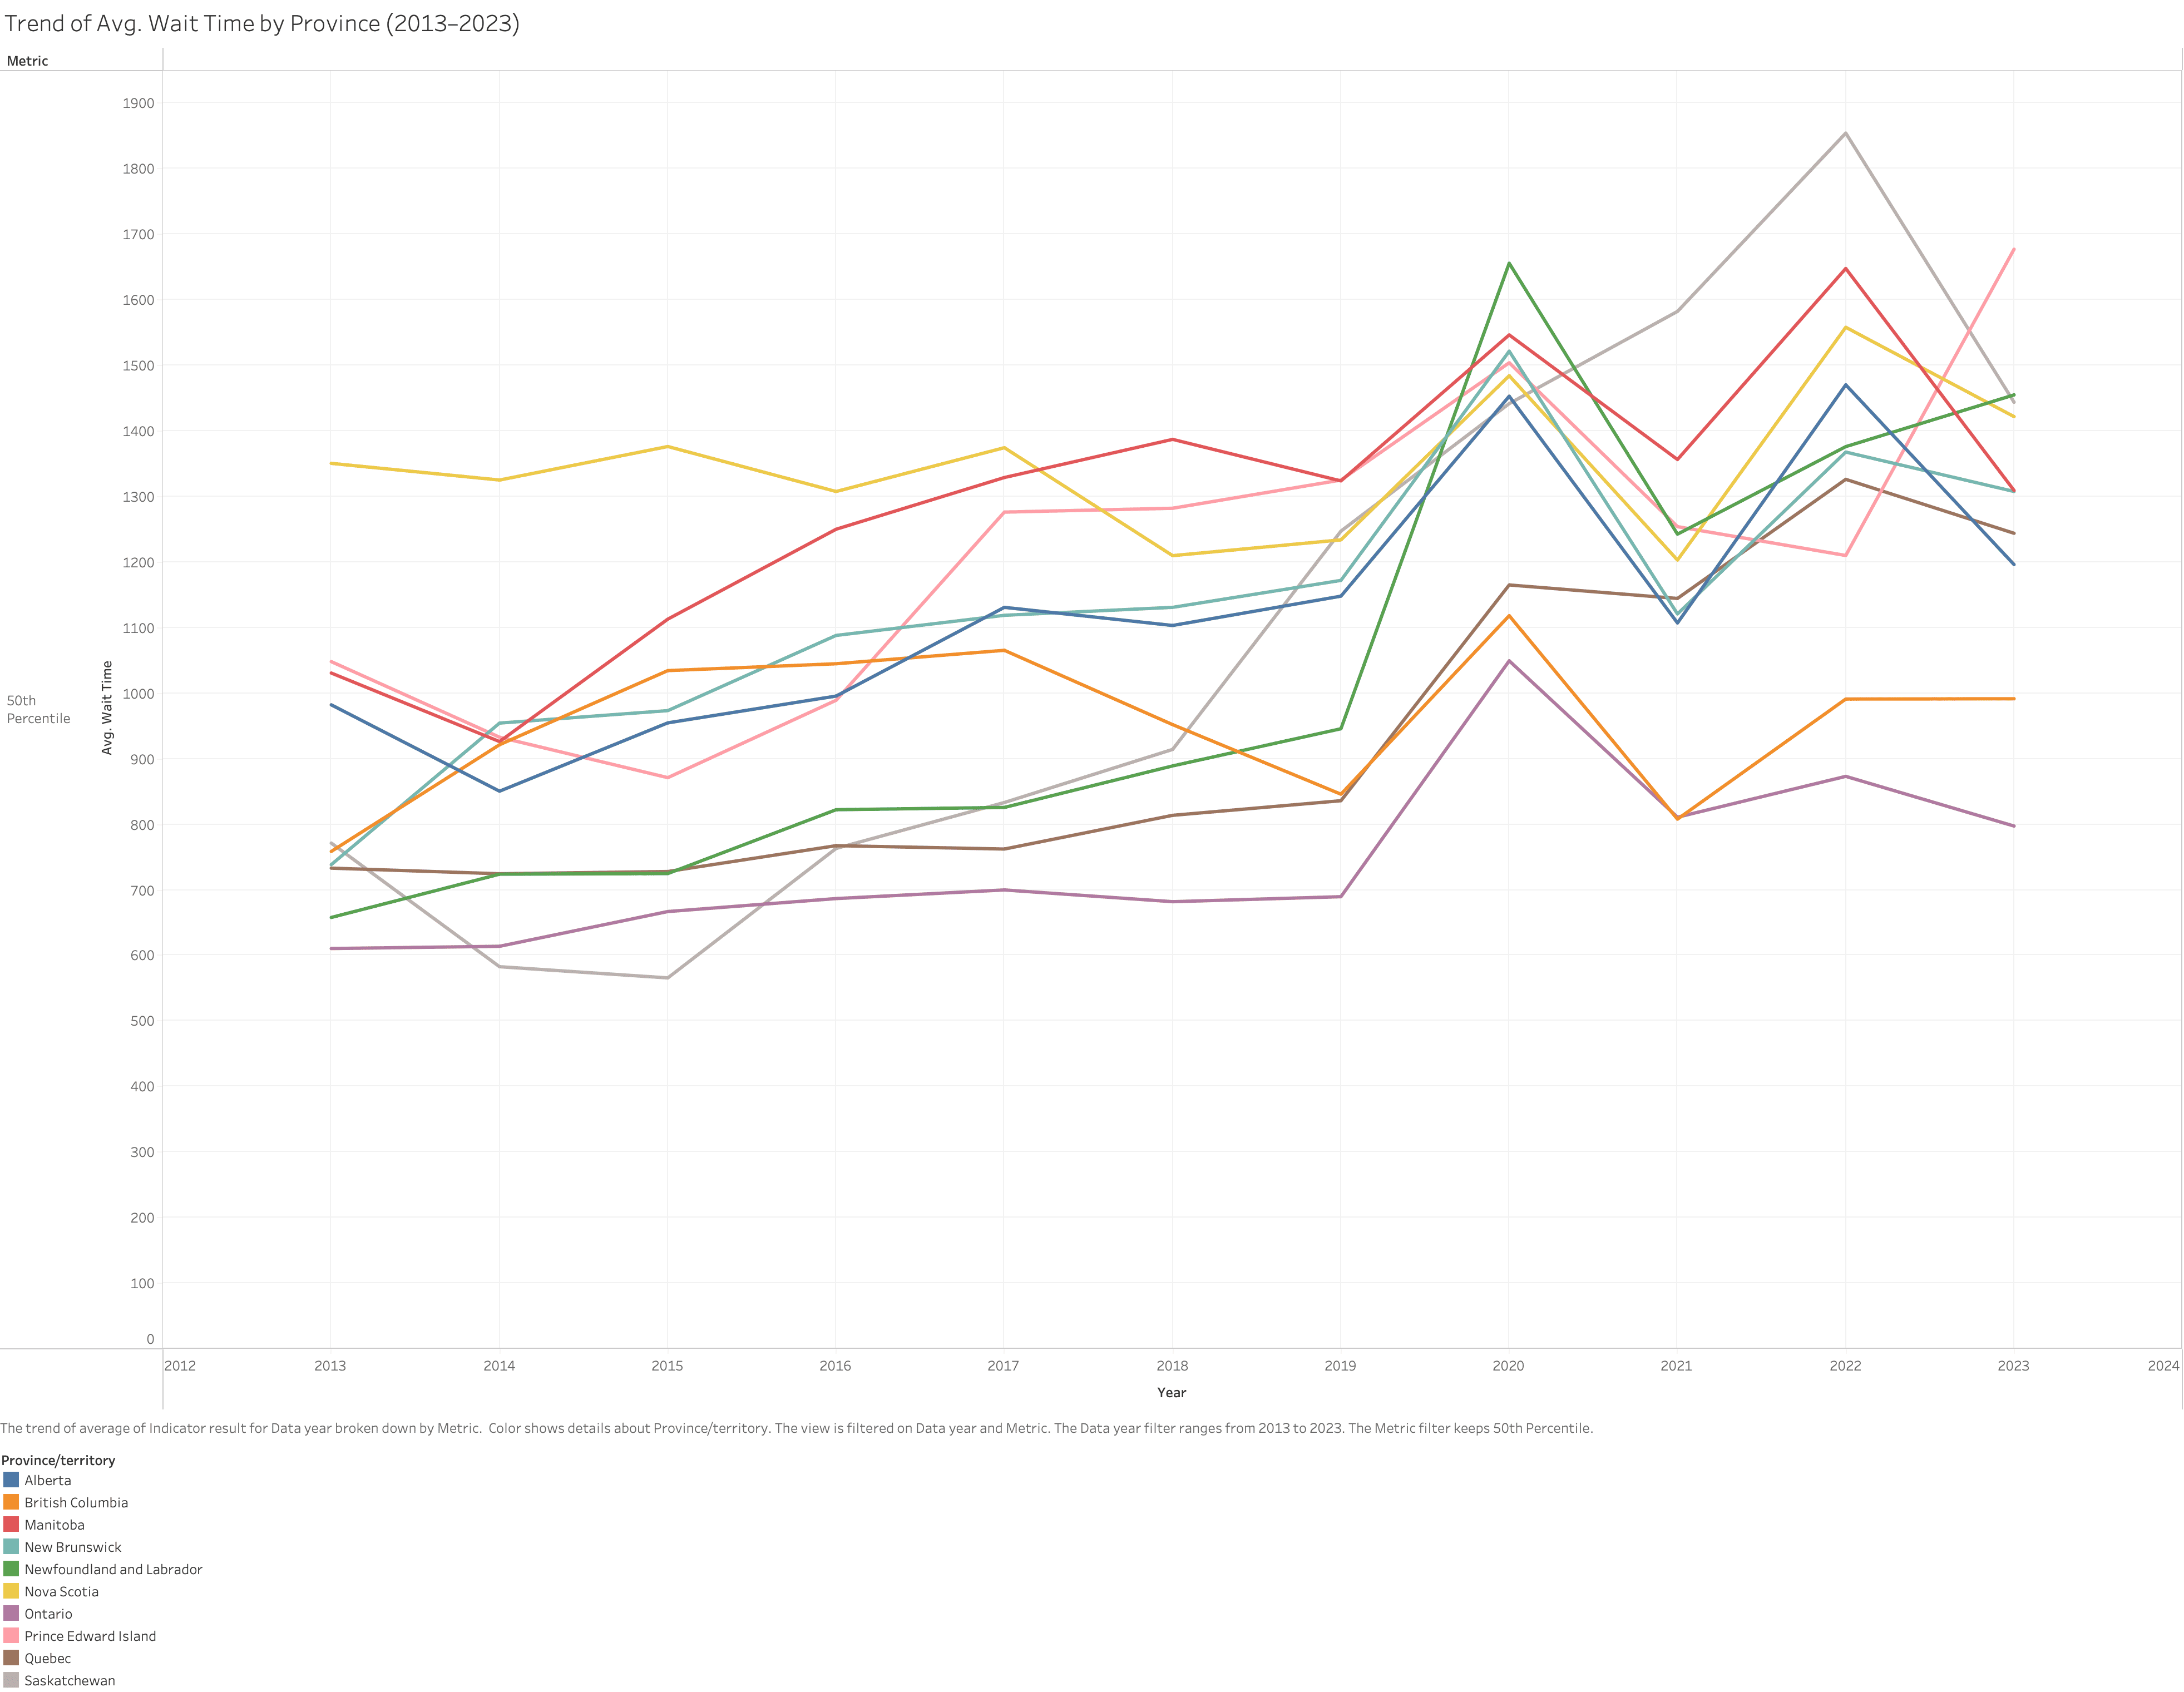
2. Wait Time Over Time
Wait times generally rose until 2019 and peaked in 2020, with mixed recovery afterward.
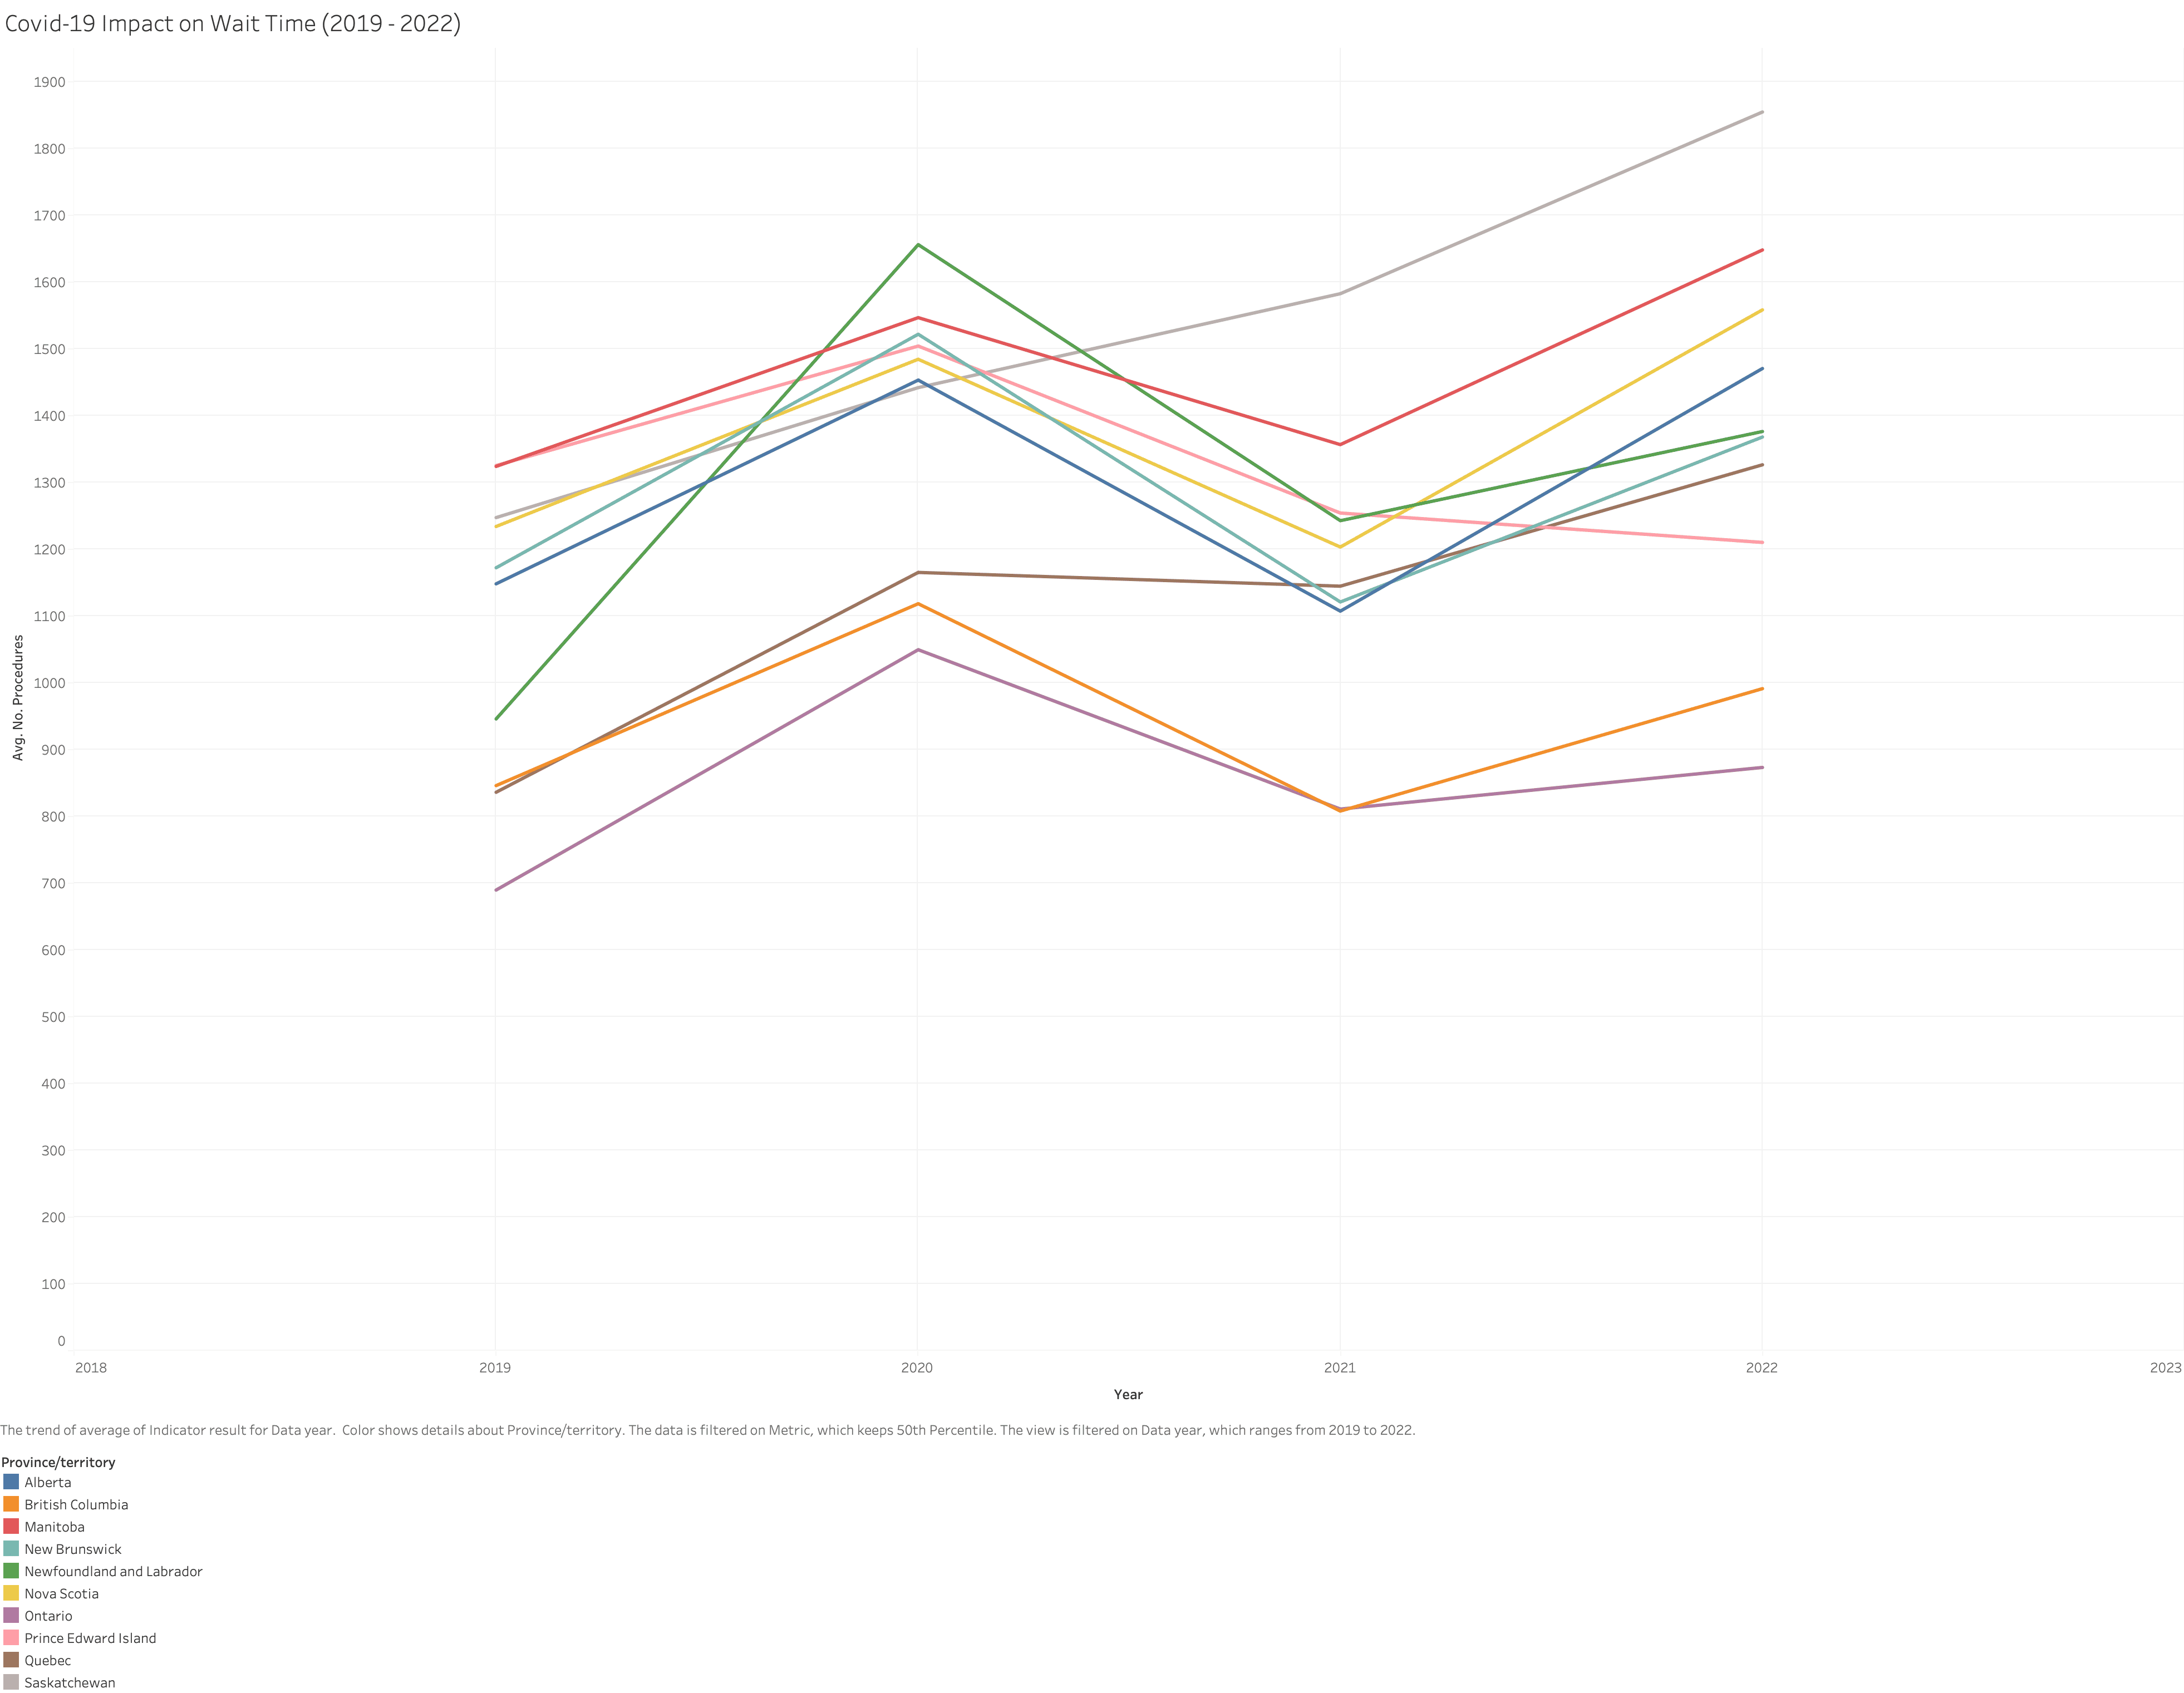
3. COVID-19 Impact on Wait Time
All provinces experienced sharp wait time increases in 2020. Some recovered by 2022, others did not.
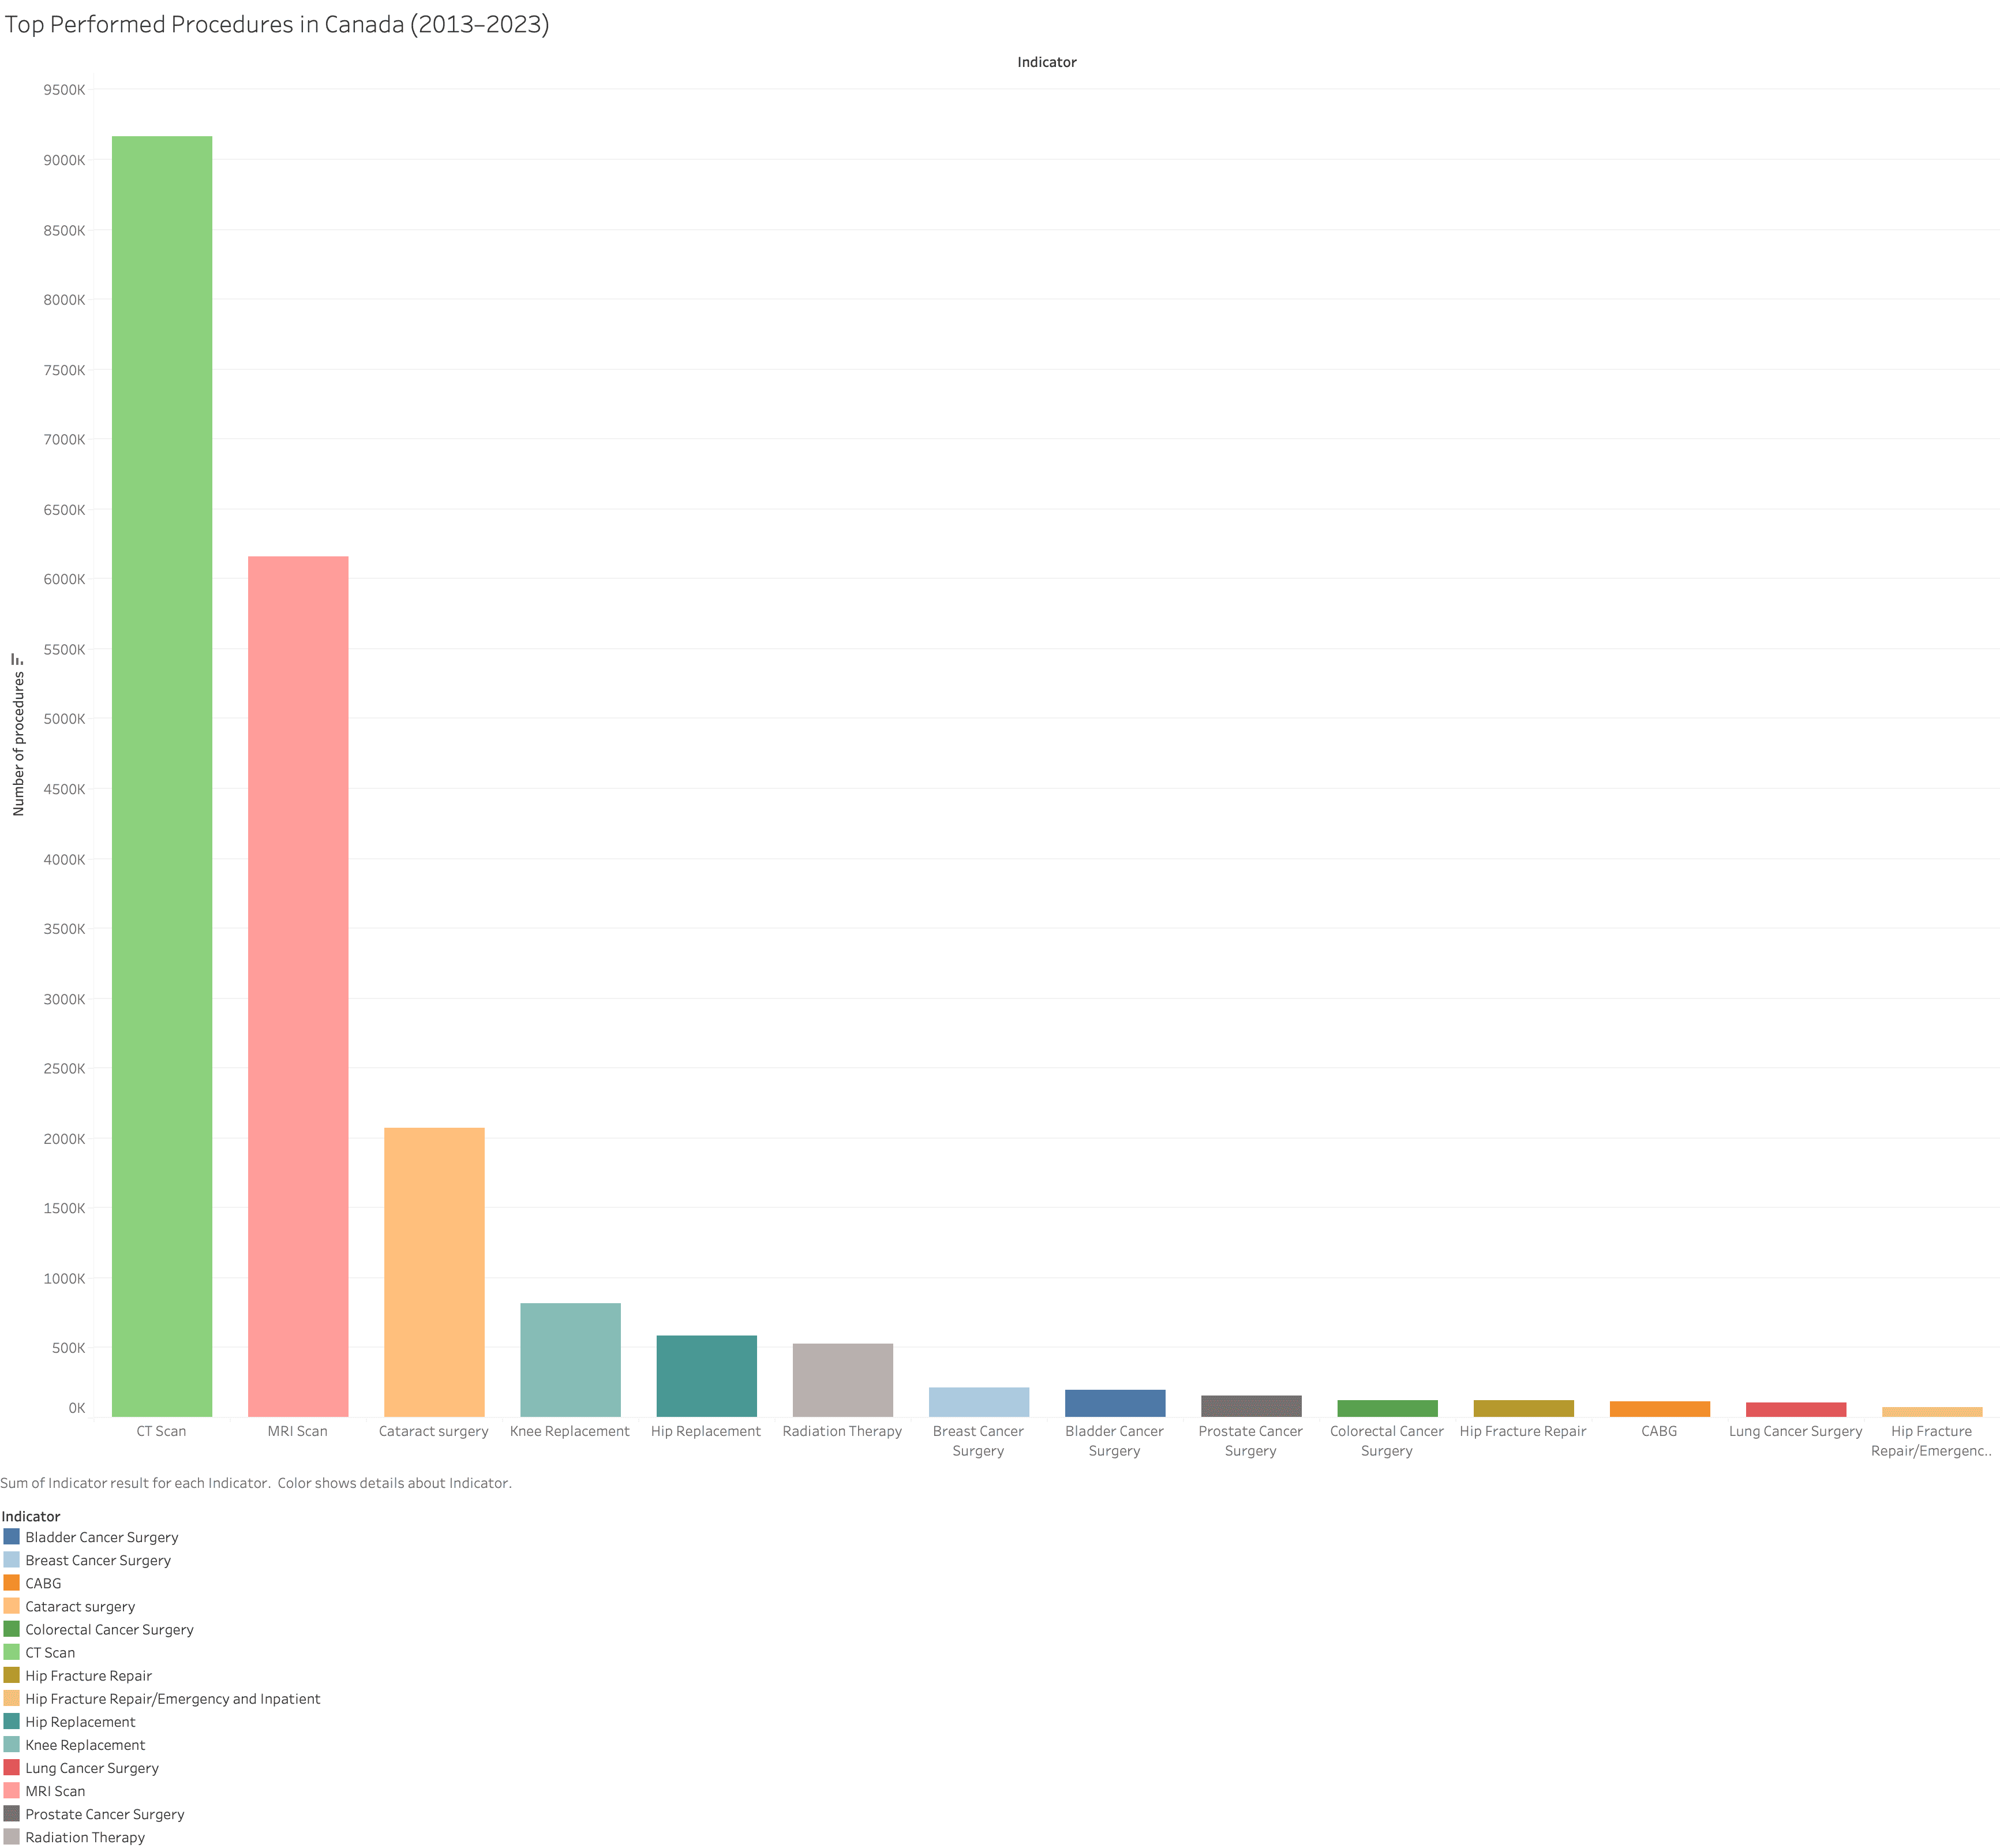
4. Most Performed Procedures
CT and MRI scans were the most common, followed by cataract surgery. Cancer-related and orthopedic surgeries occurred less frequently.
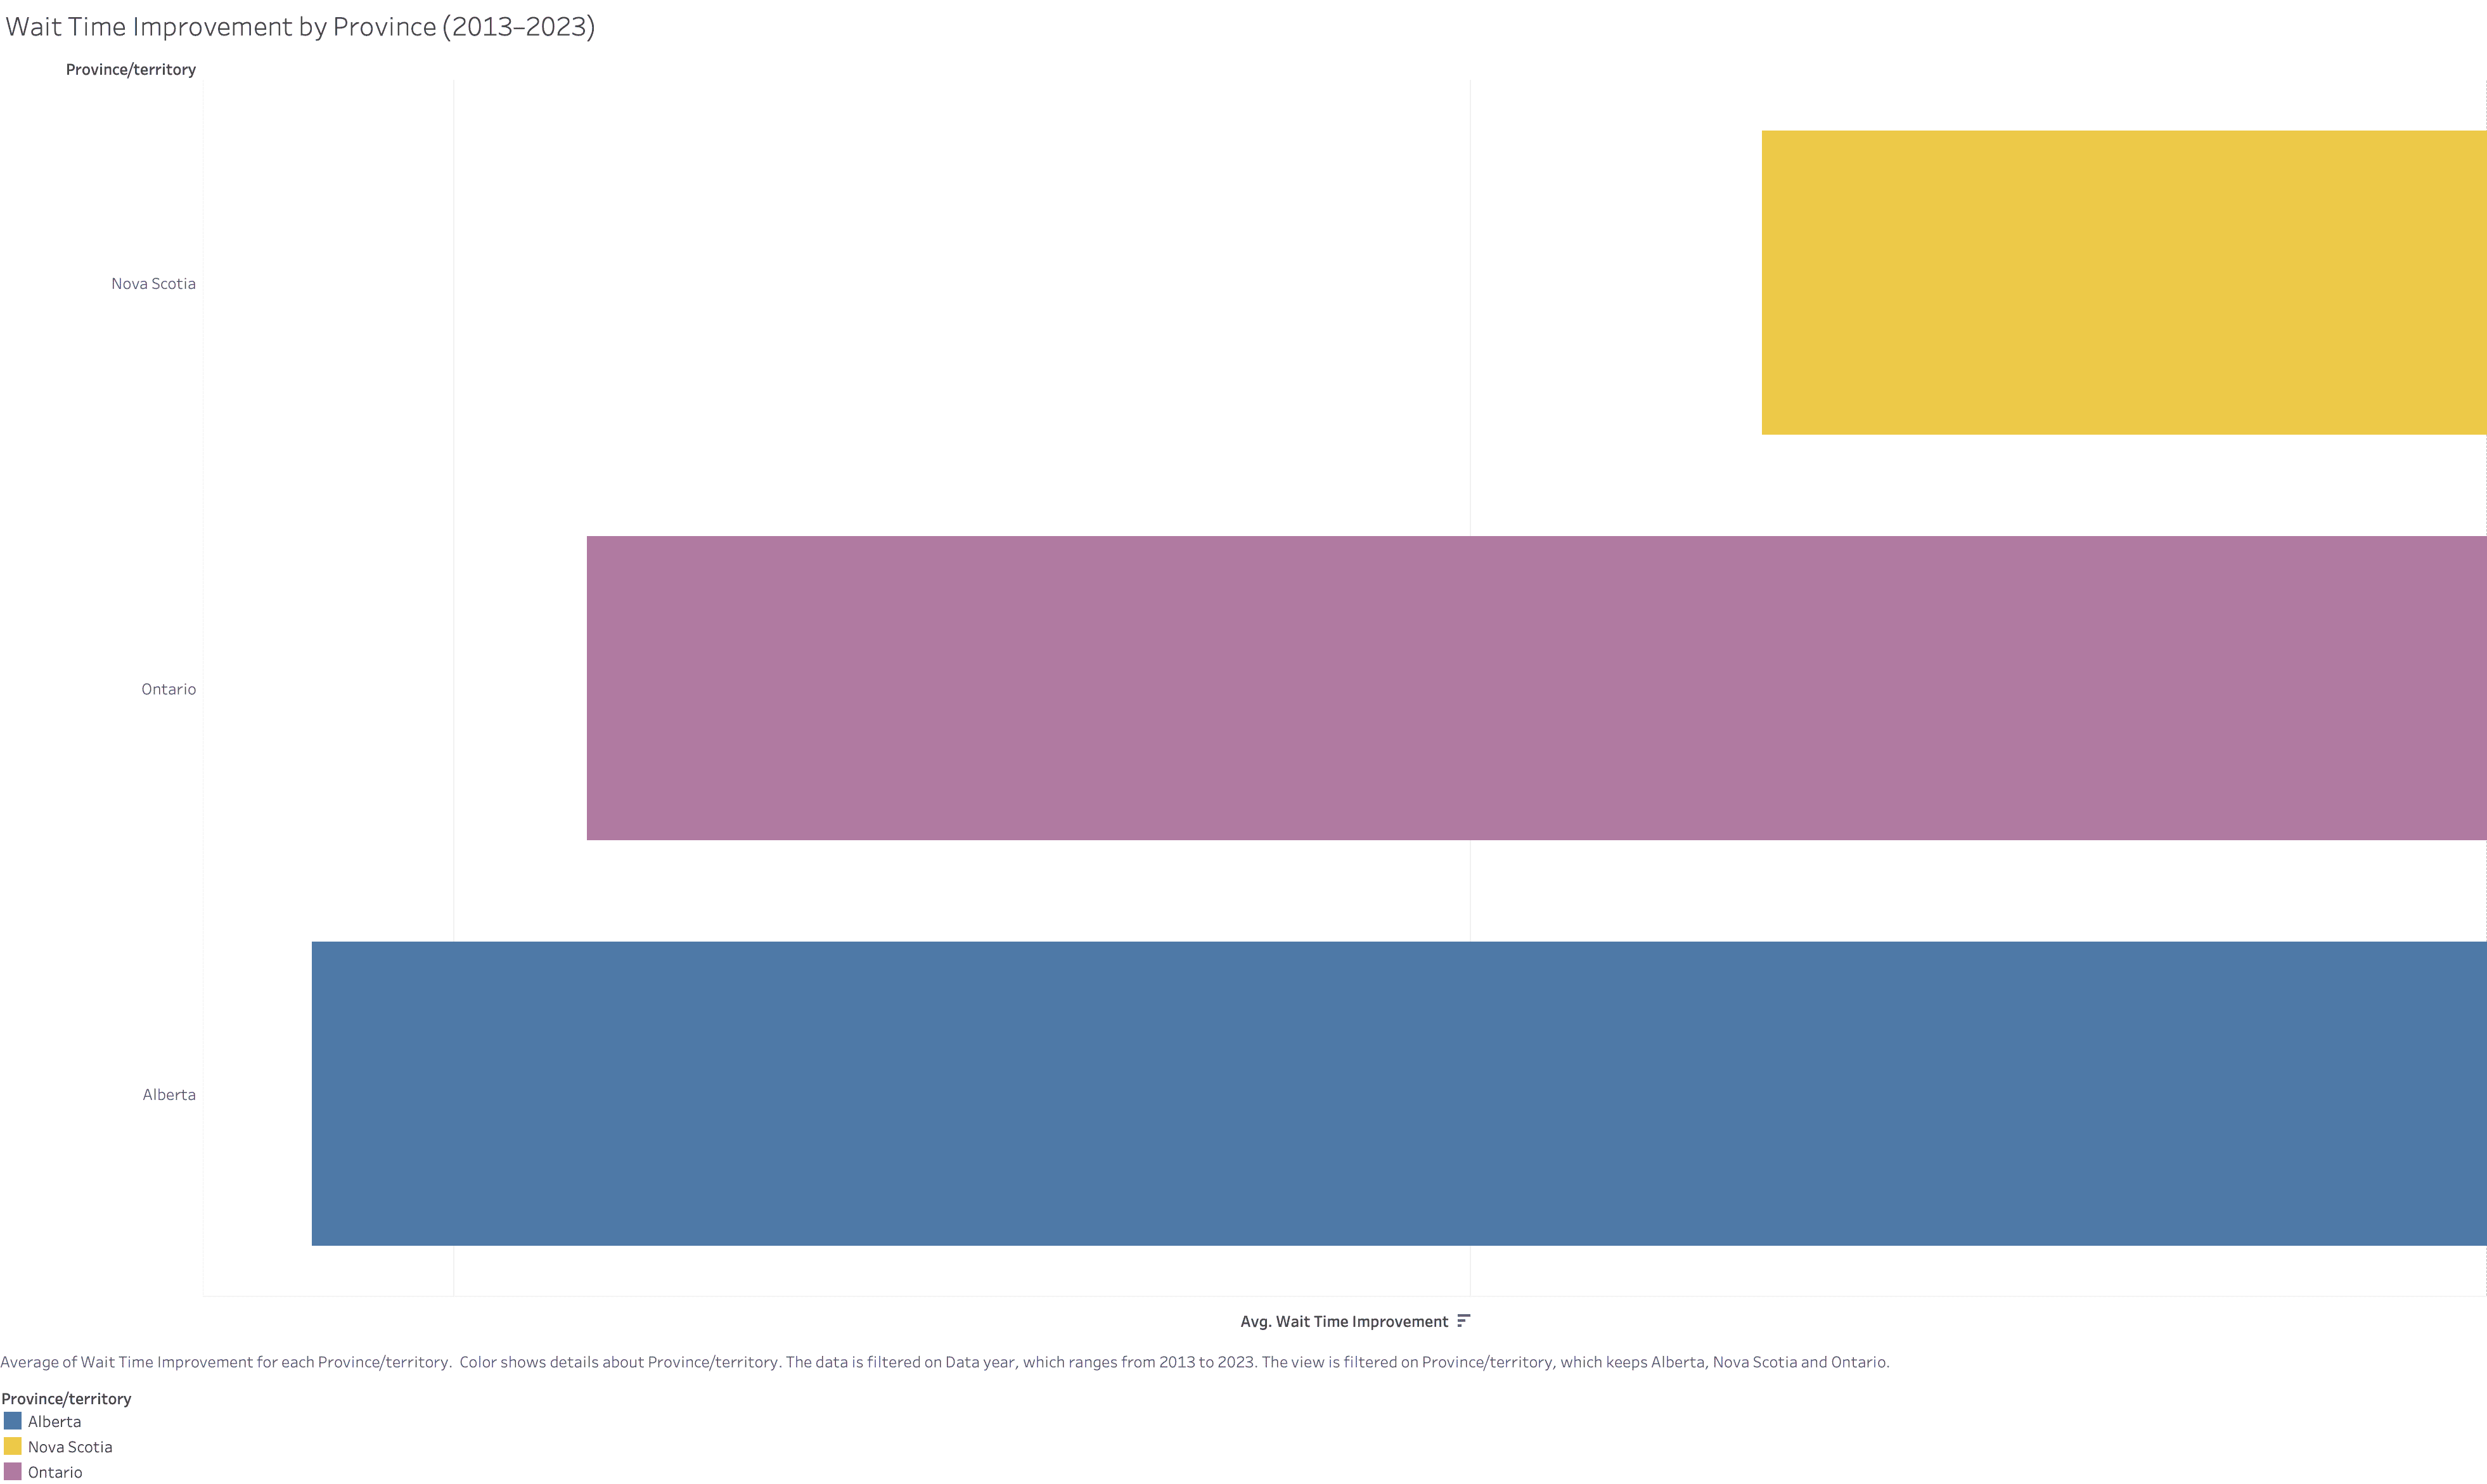
5. Top 3 Provinces for Wait Time Improvement
Nova Scotia showed the best improvement, followed by Ontario and Alberta.
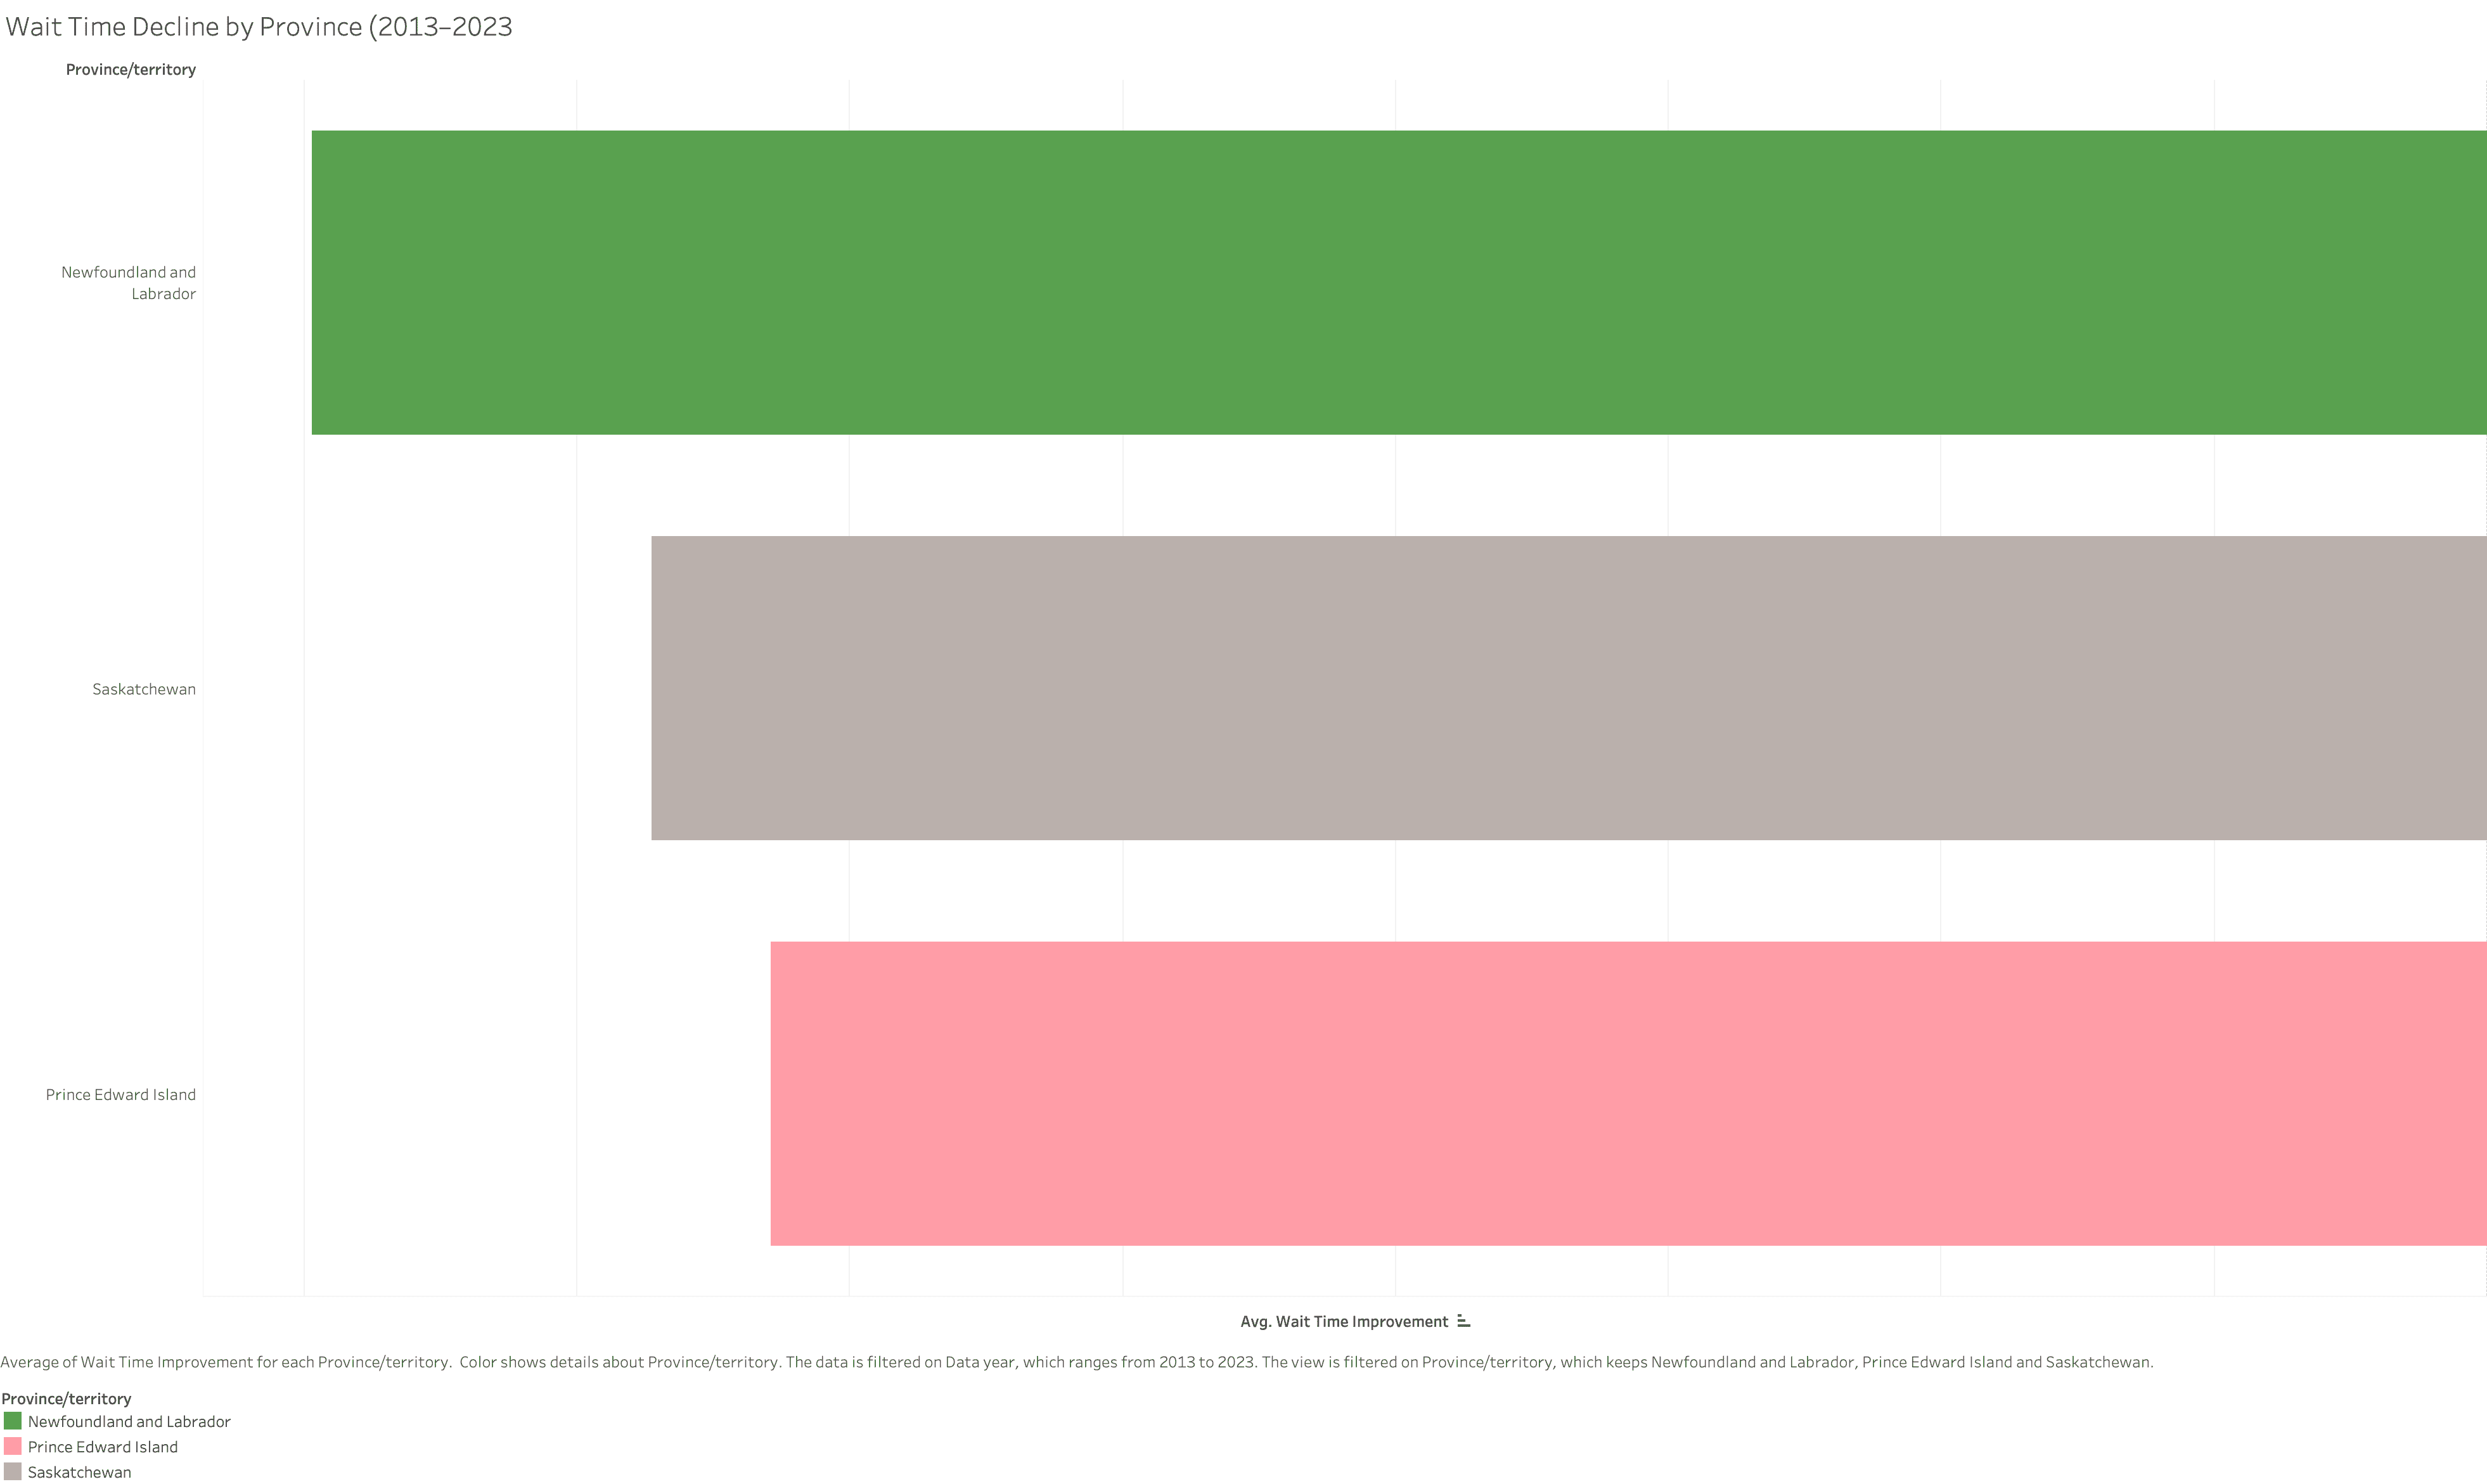
6. Top 3 Provinces for Wait Time Decline
Newfoundland and Labrador had the worst increase in wait times. Saskatchewan and PEI also saw declines.
References
• Canadian Institute for Health Information (2024). Wait times for priority procedures in Canada. • Ogunbo, J. (2025). Healthcare Wait Time Analysis Canada. GitHub: Project Link